Multifamily market performance improved and the sector outlook brightened in the first quarter of 2021, as the pace of recovery from the pandemic recession gained momentum. Although challenges remain, the principal concerns that worried investors and lenders – the fading appeal of urban living, the decline of the gateway markets, and the growing preference for homeownership among younger householders – abated and confidence in prevailing multifamily business models was restored.
Absorption
Individual property data from Yardi Matrix adjusted to eliminate distortions from new property additions indicate that net unit absorption increased in the top 50 U.S. markets during the first quarter, rising above 62,000 units in a 6,961,000-unit occupied stock sample. The figure was the largest one-quarter net since 2Q19, representing 33% and 57% increases over the prior and year-before quarters, respectively.
CoStar arrived at similar conclusions based on automated listing service data. This source recorded the largest single absorption tally since 2Q18 and the most seasonally-soft winter quarter in at least 20 years.
Notably, the distribution of tenant leasing behavior across metros suggests a reversal of the out-migration from the primary markets observed earlier in the pandemic. Metros with the largest relative quarter-over-quarter 1Q21 demand gains included Chicago, the East Bay, New York City, San Diego, San Francisco, Seattle, and Washington, D.C. Other markets exhibiting demand strength included large secondary Midwest cities (Detroit, Minneapolis), low-tax Sunbelt metros (Dallas, Nashville, Palm Beach, and Phoenix), and rising tech poles (Denver, Raleigh, and Salt Lake).
By the same token, several markets that benefited in 2020 from primary market out-migration reported distinctly slower demand growth over the winter. Occupied stock gains in the Inland Empire, Las Vegas, and Sacramento receded materially from 4Q20 levels, further evidence that some householders who sought refuge in primary market satellites returned to bright city lights when suburban leases expired or the confines of their parents’ homes grew claustrophobic.
Occupancy
Following six months of elevated supply, deliveries receded over the winter, allowing occupancy to firm. Yardi individual property data indicate that completions in the top 50 markets totaled about 55,500 units, down from more than 110,000 in the last quarter 2020 and 170,000 in the six-month period ended in December.
Consequently, stabilized same-store occupancy advanced 0.11% (11 basis points) sequentially to a 94.30% quarterly average – the highest rate since the beginning of the pandemic. The level stood at 94.33% in March, down only three basis points (bps) year-on-year, and within four bps of the February 2020 pre-pandemic level.
A combination of supply pressure, tenant price resistance and the spatial freedom enjoyed by tenants working from home resulted in distinct underperformance in the Class A segment last year. Average class occupancy fell -44 bps to 93.72% between 1Q20 and 4Q20, while Class B properties recorded a four bps increase to 94.39% in the same period.
But Class A demand appeared to reach an inflection point in November, as tenants began to return to urban neighborhoods. November-to-March class occupancy spurts were observed in Chicago (124 bps), Miami (154 bps), New York (154 bps) and, impressively, San Francisco (229 bps), trimming the gap between A and B occupancy from 58 bps in November to 44 bps in March.
Trends in the Class C segment were steady. Class occupancy averaged 94.49% during 1Q21, down from 94.53% during the fall quarter, and 94.84% in 1Q20. The fill rate improved to 94.51% in March from 94.48% in December.
Rent Trends
Rent trends gained momentum in the winter quarter and popped in April. Same-store property rents in the top 50 markets increased on a unit-weighted average 1.02% annual pace in the first quarter, up from 4Q20’s comparable 0.59% rate, and 2.32% in April, a post-pandemic high.
Class A rent trends improved materially. After falling on a -1.53% trajectory in 4Q20, annual class comparisons improved to -0.82% in 1Q21, -0.20% in March and +1.11% in April. Class C assets posted the fastest 1Q21 (2.45%) and April (3.00%) annual growth, followed by class-B on 1.88% and 2.93%.
Metros benefiting from the primary market exodus continued to record rapid rent growth, while the primary markets searched for traction. April trends in the Inland Empire (9.91%), Phoenix (8.83%), Sacramento (8.82%) and Colorado Springs (8.22%) ranked in the peer group top four, and Las Vegas (7.64%) and Norfolk/Richmond (6.99%) were sixth and eighth. The Sunbelt growth and low-tax alternative markets filled out the top 10, led by Palm Beach (7.75%), Atlanta (7.03%), Tampa (5.94%) and Jacksonville (5.77%). A few of the better performing Midwest markets (Columbus, Detroit, Indianapolis); an assortment of low business and tax cost competitors (Charlotte, Fort Lauderdale, Fort Worth and Salt Lake); and steady middle Atlantic markets (Baltimore, Philadelphia) occupied spots in the top 50 second quintile, posting annual gains between 4.0% (Fort Worth) and 5.3% (Columbus).
San Diego (3.79%) and Chicago (0.38%) were the sole primary markets to crack the peer group top 40, ranking 20th and 39th, respectively. The balance of the primary markets continued to post negative comparisons in April, with New York, San Francisco and San Jose still down more than 10% year-on-year. Average rent rebounded from January lows, however, with most segments gaining 0.7% or more, the exceptions being San Francisco, Seattle and Washington, D.C.
Tenants Begin to Return to the City Center
Now that the worst of the pandemic is behind us and commerce in cities beginning to normalize, will tenants who relocated from central city neighborhoods return? We took a deep dive in the numbers to assess the prospects.
For metros with singular, readily identifiable city centers (the top 50, less Norfolk, Orange County and Raleigh) we calculated the distance between each of more than 30,000 stabilized, same-store properties in the Yardi coverage universe and their respective city centers using latitude and longitude coordinates. Rent and occupancy trends were calculated for each and analyzed to determine the relevance of city center proximity on performance.
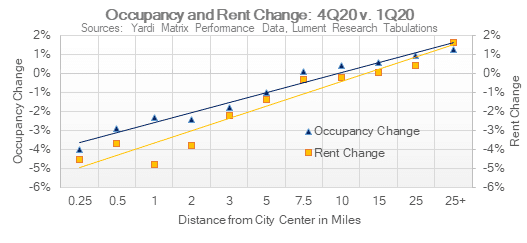
The results evidence that occupancy and rent trends were highly inversely correlated to distance from the city center during the pandemic. Indeed, a simple linear regression between distance cohort performance and distance demonstrates that proximity explains 85% of 1Q21 year-on-year change of distance cohort occupancy and 83% of annual rent change. Distance cohorts are mapped in the graph below.

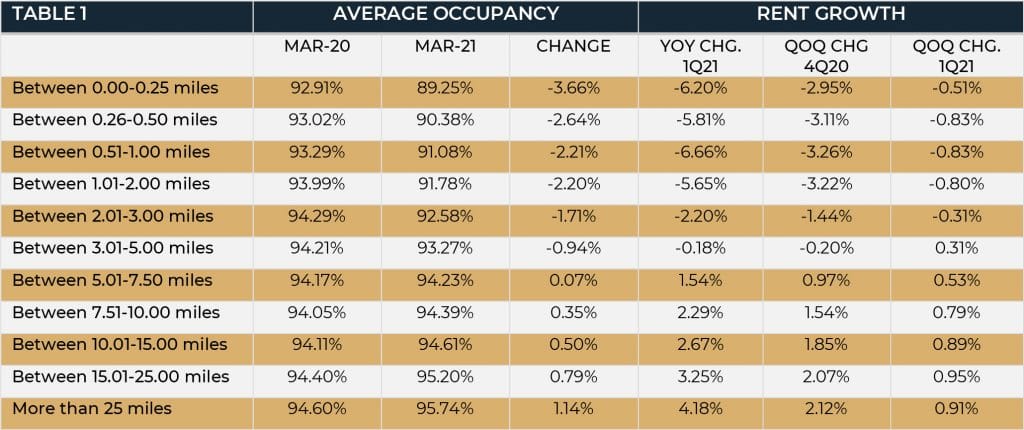
Properties located within 0.25 miles of the city center experienced average occupancy losses of 411 bps to 89.18%. With the exception of the 0.51 to 1.00 mile proximity group (-237 bps) and the 1.01 to 2.00 mile cohort (-249 bps), performance in each cohort improved as distance increased. The pattern was replicated for rents, but in this instance only the 0.501 to 1.00 mile cohort (-6.67%) under-performed a more proximate cohort: the 0.261 to 0.50 mile group (-5.81%).
This quantifies a relatively well-established phenomenon, but the statistics also provide a few insights of greater novelty. For example, the data strongly suggest that the performance inflection point fell on about five miles from the centroid, with properties beyond five miles reporting materially stronger metrics than more proximate cohorts. Performance consistently improved as proximity declined, reaching an apex beyond 25 miles.

The data also demonstrate that the proximity tide turned over the winter. Sequential quarter occupancy improvement among cohorts located within two miles of the city center ranged from 45 bps to 61 bps, while more distant samples improved 21 bps or fewer. In other words, the renter tide that went out of the city last year began to come back in the New Year.
Although sequential quarter rent growth remained in negative territory within a three-mile radius, each of these samples recorded significant sequential rate of change improvement. By contrast, cohorts beyond the three-mile radius chalked rent growth deceleration.
The evidence implies that the tenant out-migration observed during the pandemic reversed direction over the winter. It is too early to assess the strength and longevity of this phenomenon, but the data suggest that core urban occupancy performance may improve faster than widely perceived. Urban rent strength, on the other hand, has not fully stabilized and will take time, perhaps a matter of years, to fully recover.
Capital Markets
Apartment transaction activity decelerated seasonally during the first quarter following brisk fourth quarter trade. Yardi recorded a 36% sequential quarter decrease in the top 50 U.S. markets, but tabulated an 11% gain over the prior year period.
The average price paid per unit declined -2.7% from 4Q20 to $178,865, but climbed 9.30% year-on-year. Real Capital Analytics reported that its apartment property price index increased 7.1% year-on-year and 2.1% sequentially, bettered among core CRE segments only by industrial properties.
Buyers moved down the price scale, elevating Class B garden and workforce housing investment share from 32% of total volume in 4Q20 to 39%. The shift in emphasis came at the expense of Class A share, which dipped from 27% to 21%. This migration from Class A purchases was manifested by weakness in mid- and high-rise sales, as infill assets remained out of favor with buyers.
Cap rates compressed further, boosted in part, by stronger pricing for elevator buildings. Available government sponsored enterprise (GSE) and data service reports indicate that purchase cap rates of major market institutional-quality buildings in 1Q21 averaged about 4.53%, down about two basis points from 4Q20. With respect to yield, buyers made little or no distinction between garden and mid- or high-rise designs.
In the debt capital markets, higher 10-year Treasury rates pushed coupon interest levels higher. Trepp data indicate that mortgage interest rates averaged about 3.0% in 1Q21, up from 2.7% in the prior quarter. At the same time, Treasury spreads were firm in the 175 bps area. Underwriting ratios appeared to ease moderately and typical debt leverage rose as asset performance exceeded expectations during the pandemic recession. Average GSE loan-to-value (LTV) ratios increased about 1% and debt yields broadly fell.
Outlook
The multifamily sector continued to outperform expectations in 2021 and is well positioned to prosper as the economy and housing markets normalize. Although disparities remain between markets, the gateway cities are rebounding with considerable strength, and pent-up demand for space is being expressed across markets and neighborhoods as renters and would-be renters contemplate new options after months of relative isolation. Indeed, the spring and summer leasing season is shaping up to be one of the strongest since the late 1990s. Strong property cash flows and investment returns appear baked into the cake through year-end. Inflation, economic and asset price overheating, and interest rates represent the only major threats, and these are unlikely to derail the recovery in the near term. John Maynard Keynes’s quip regarding the long-term has never felt so apt: enjoy the ride.


